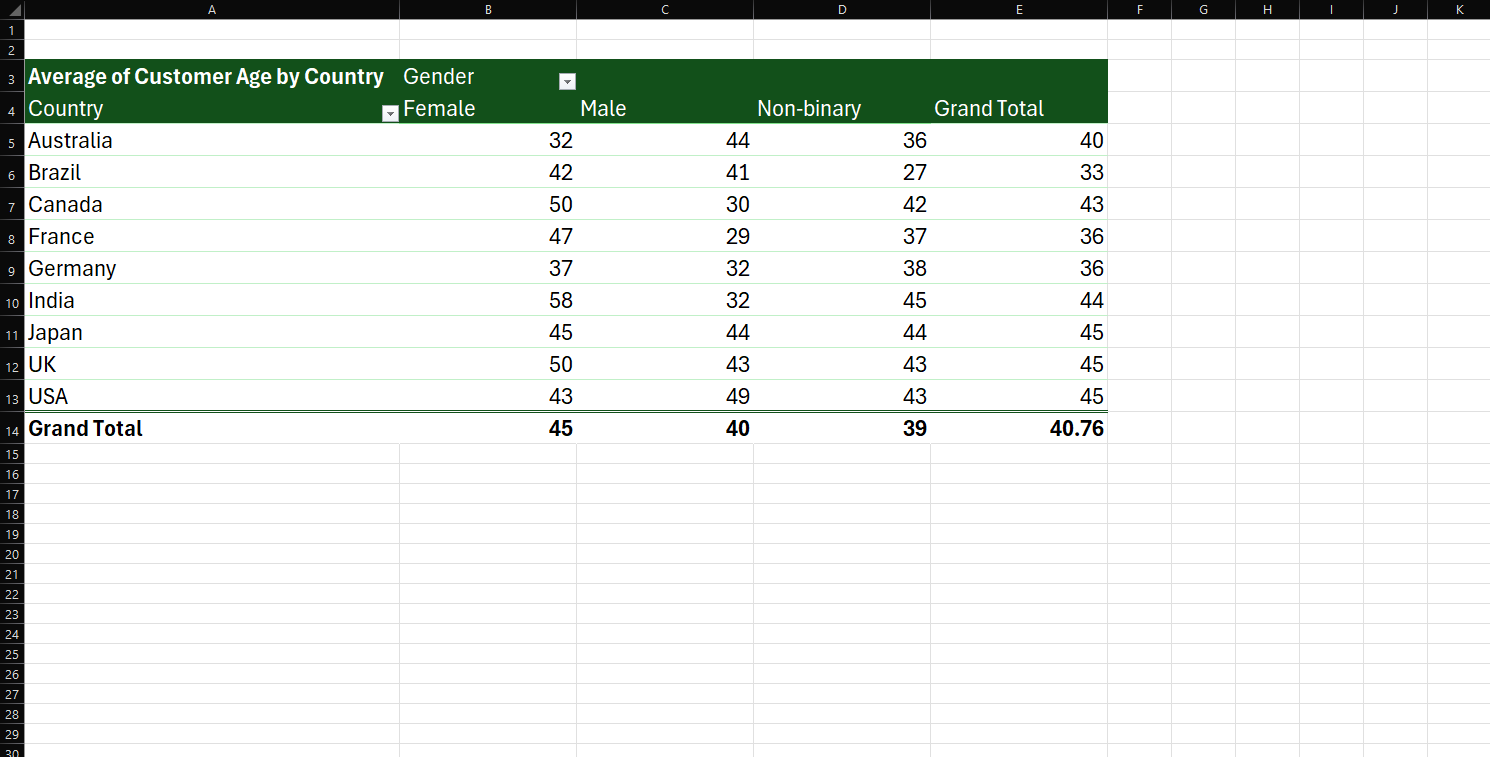
Pivot tables are like the Swiss Army knife of data analysis—they can seem daunting at first glance, but once you understand their functionality, they become an indispensable tool for organizing and summarizing large datasets. Here’s a beginner’s guide to help you navigate the world of pivot tables.
What is a Pivot Table?
At its core, a pivot table is a data-processing feature found in tools like Microsoft Excel or Google Sheets. It allows you to extract meaningful information from a sea of data by summarizing, analyzing, and reorganizing it without altering the original dataset. Think of it as a way to create dynamic reports on-the-fly.
Why Use Pivot Tables?
Pivot tables are perfect for answering questions like:
- What are the total sales per region?
- How many products were sold in each category?
- What trends can be observed over time?
Instead of manually combing through rows and columns, a pivot table lets you pull the answers with just a few clicks.
Getting Started: The Basics
To create a pivot table, follow these general steps:
- Prepare Your Data: Ensure your dataset is well-organized, with column headers that clearly describe the data in each column.
- Select Your Range: Highlight the data you want to analyze.
- Insert Pivot Table: In Excel, go to the Insert tab and choose “Pivot Table.” Select where you’d like the table to appear—either in a new worksheet or the current one.
- Set Up Fields: Drag and drop columns into different sections:
- Rows: These will appear as labels along the side.
- Columns: Labels across the top of the table.
- Values: The data you want to calculate, such as totals or averages.
- Filters: Narrow down your focus by filtering specific data points.
Examples of Pivot Table Magic
Imagine you’re managing a store and have a sales database. You can use pivot tables to:
- See total revenue per product category.
- Analyze monthly performance trends.
- Spot which items are most popular in specific regions.
By changing fields or applying filters, you can instantly adapt the pivot table to answer different questions—it’s like playing with building blocks!
Tips for Beginners
- Start Small: Begin with a simple dataset to familiarize yourself with pivot table basics.
- Experiment: Play around with the Rows, Columns, Values, and Filters sections to understand their impact.
- Use Slicers: These interactive buttons can make filtering data even easier.
- Check for Errors: Pivot tables depend on clean, consistent data—double-check for missing values or typos in your dataset.
Pivot tables may seem intimidating at first, but they are incredibly powerful once you understand their mechanics. They transform raw data into insightful reports, saving time and effort while improving accuracy. As you practice and experiment, you’ll discover that pivot tables are not just a tool—they’re a secret weapon for effective data analysis.

